Gantt Project Management
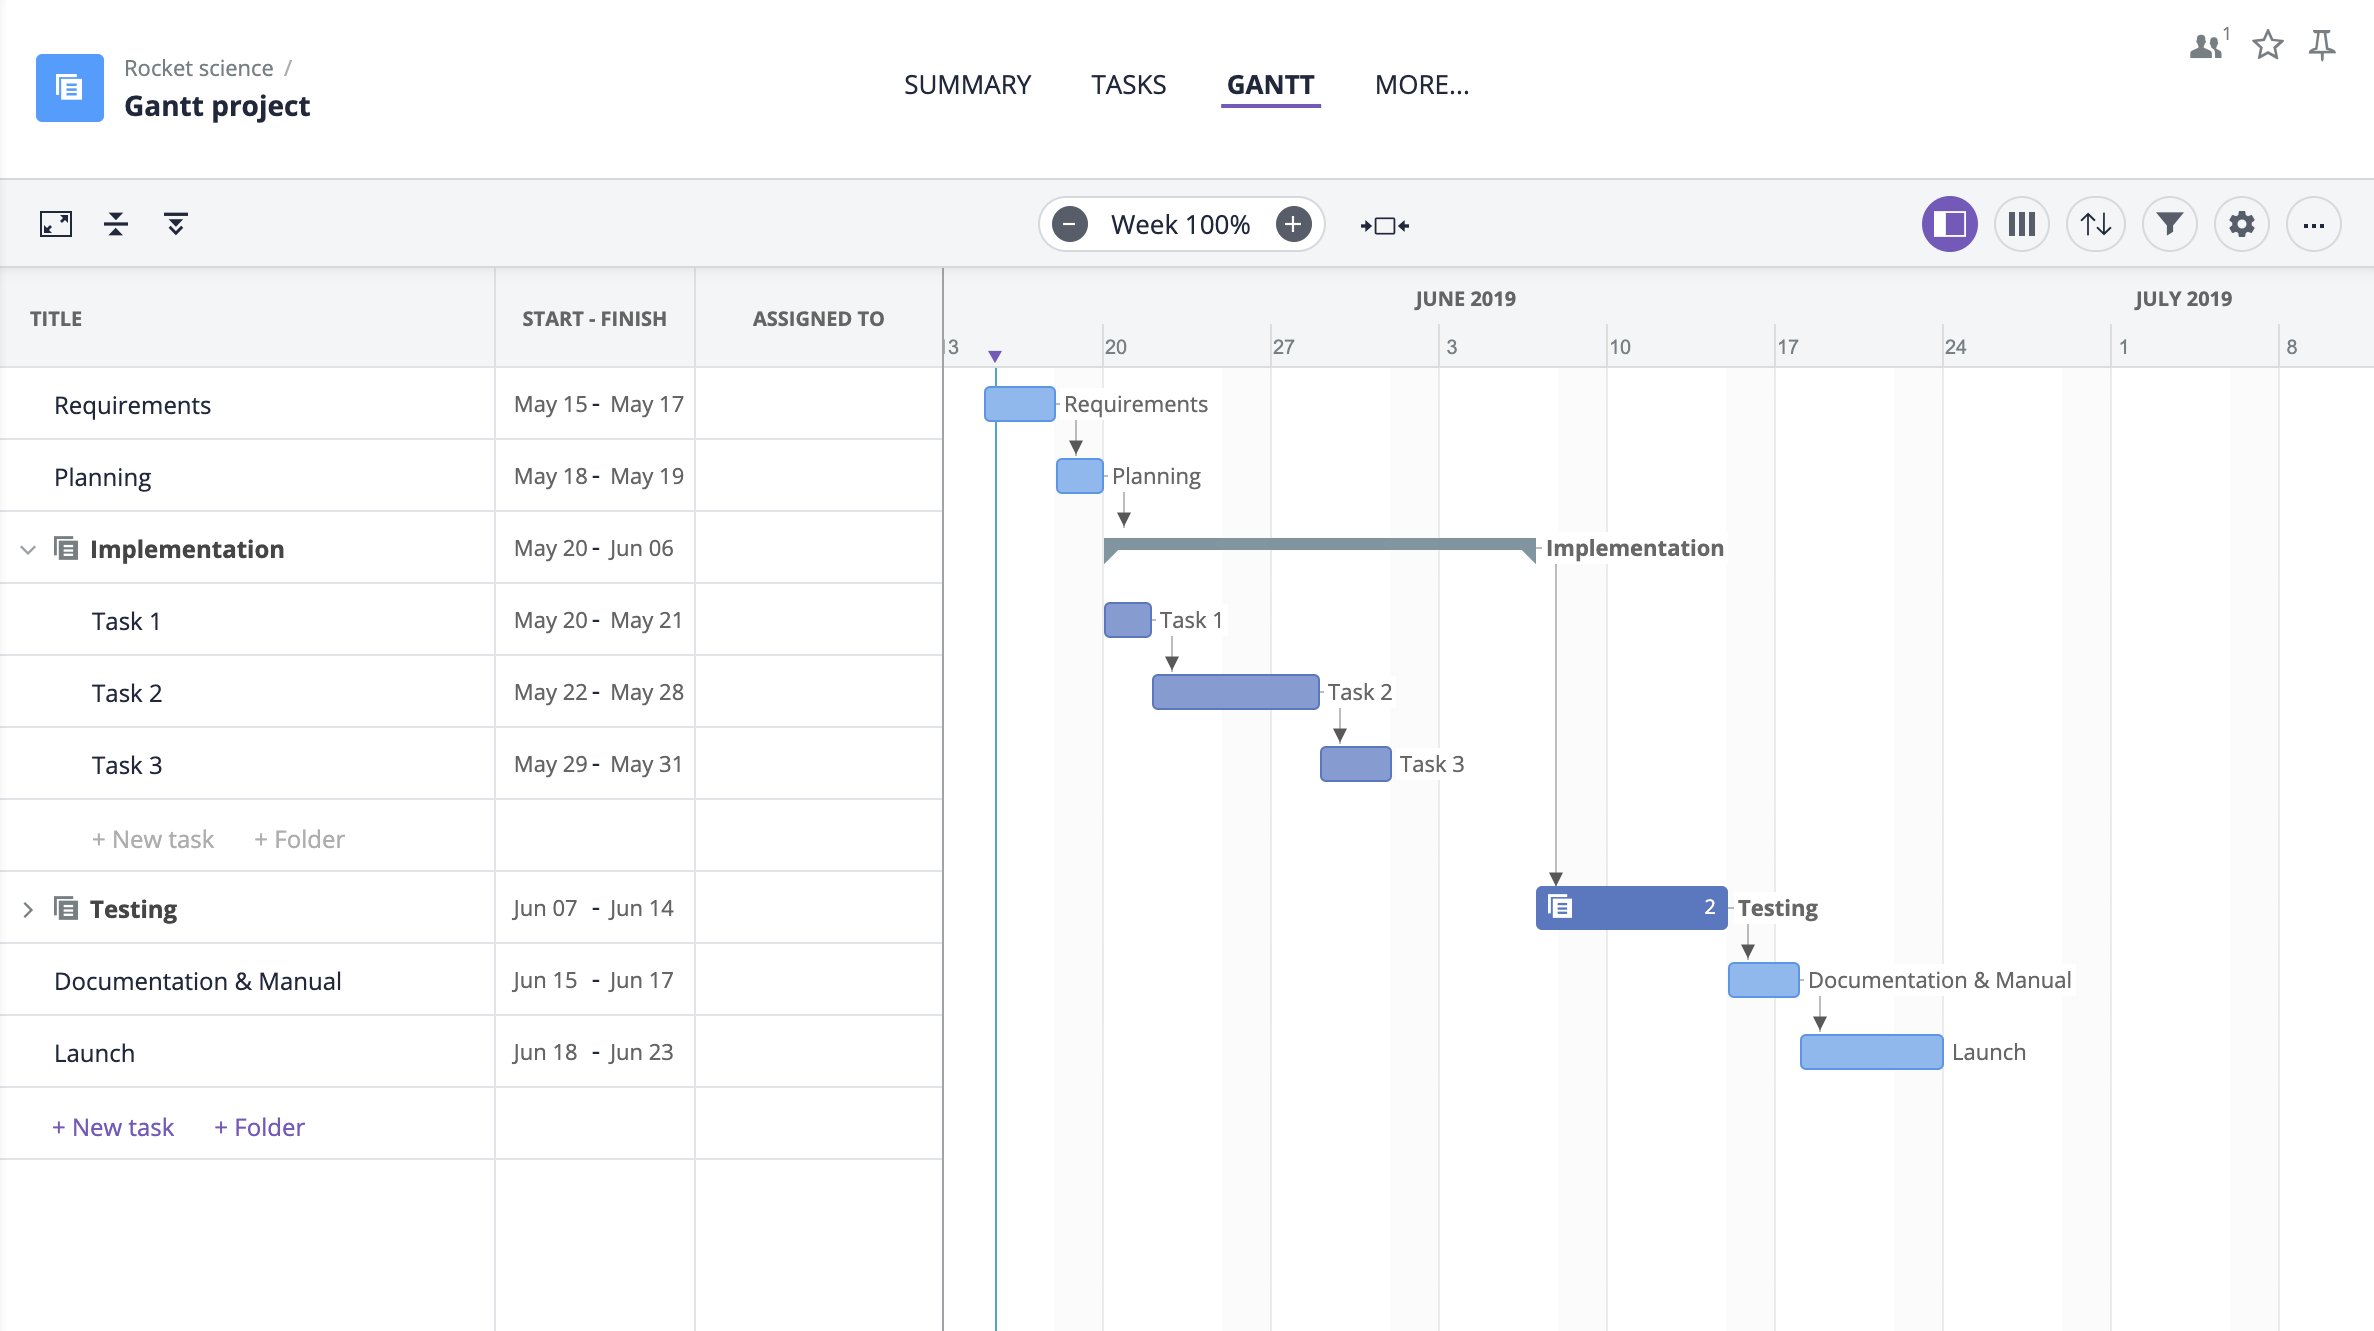
This Gantt chart template is a great way to plan projects of any size, allocate resources, manage tasks, subprojects, events, and dependencies.

What is a Gantt Chart Software?
The Gantt Chart is probably the most used project management tool. They are the cornerstone of project management and a great way to keep your team on track.
Gantt Charts are bar charts that consist of dates, tasks, and subtasks with milestones that need to be completed. For the successful completion of your projects every team member needs to follow their milestone deadlines.
If one task is not completed, then the entire project will be delayed. One task cannot start if the previous task is not done. The milestones depend on each other. Gantt Charts will show you how tasks fit into one another and give you the bigger picture of the project.
Who uses Gantt Chart Software?
These days, people work across many departments or teams to carry out their projects. Some employees work under different managers. A UI wireframe design team may need to communicate with the software development team and the marketing team for a new application.
Nearly everyone with different working backgrounds or experience can use Gantt chart software to visualize their projects. Although Gantt Charts are used by most people these days, they are still mainly used by project managers and team managers.
The Benefits of using Gantt Chart Software
Gantt Charts provide a lot of value for project managers and teams. With Gantt Charts, you can easily communicate milestones to the rest of your team and provide a visual representation of when a task should start and end. Communication is key to every project. Every member of the team will know exactly how far along a project is and why it is held up.
Gantt Charts will allow for logical expectations. The team will know exactly how much time they have to work on each project before the deliverable is due. You can see the amount of work allocated to each member of your team and prevent resource overload. Resource overload can result in failed deadlines.
Track your team's progress and see how far along they are with their tasks. You will have a great view of how far behind or ahead of schedule, your project is. Once your Gantt Chart project is complete, you will have some peace of mind. You can visually see how you achieved your deadline.
Key features of GoodDay’s Gantt Chart Template
There are a lot of features included in this GoodDay Gantt Chart template. As a project manager, it is important to have a good project hierarchy. You can create subprojects, events, milestones, tasks, and subtasks.
To make your life even easier is the fact that you can fully customize your task list columns and their order, including the system and custom fields.
You can make use of filtering. Create filters to use in your tasks applying different criteria such as Action Required user, assignee, dates, subprojects, and more.
Use drag & drop to set start/end dates and milestones so that your team is aware of their expected deadline. You can group your tasks, subtasks, and milestones.
This Gantt Chart template allows you to export your data and charts into CSV and PDF formats. This way, you can keep each project's Gantt Chart stored for reference.
This Gantt Chart template is perfect for time-bound projects. You can easily and strictly control your deadlines. The two key views, Gantt, and Workload will allow you to perfectly visualize your workflow.
 Summary
  Task List
  Task Table
  Gantt Chart


